Developing an operational information service requires collaboration between operator and scientific software engineer
By Werner Kramer
The people who monitor and manage the Dutch coastal waters must quickly assess very complex information. This requires a specialized information system that is closely aligned with their way of working and thinking. Building such an information system not only requires a developer with domain knowledge, but also a good collaboration between the user and the developer. In this blog, we show several examples of how this works in practice.
Water information service
The Dutch Department for Waterways and Public Works, Rijkswaterstaat, provides information about the coastal waters and the main inland waterways through the site waterberichtgeving.rws.nl. This is an important source of information for water authorities, provinces, safety regions, but also for the commercial sector.
The site is maintained by Rijkswaterstaat’s Water Management Center Netherlands (WMCN). This is a collaboration between the Dutch water management institutes and the meteorological service KNMI, both nationally and regionally.
Hydro meteo advisors at the WMCN are working 24/7 to maintain the information on the site and assist users. These advisors are specialists: they know the Dutch water system in detail. They know how the weather conditions will play out and where critical situations can arise. They need to process a lot of information quickly and therefore need to have intuitive access to it.
VORtech, together with water knowledge institute Deltares, is involved in the development of the specialized information system that the advisors use. Part of the system are maps and charts that show model forecasts and observation data. The backend of this functionality is now based mostly on standardized web components. For example, the Digital Delta Digital Delta API is used to access the data for time series in a standard way. The same goes for the OGC Web Map Service standard for spatial data. The front-end components of the system are built from modern web frameworks.
Low level tools for full control

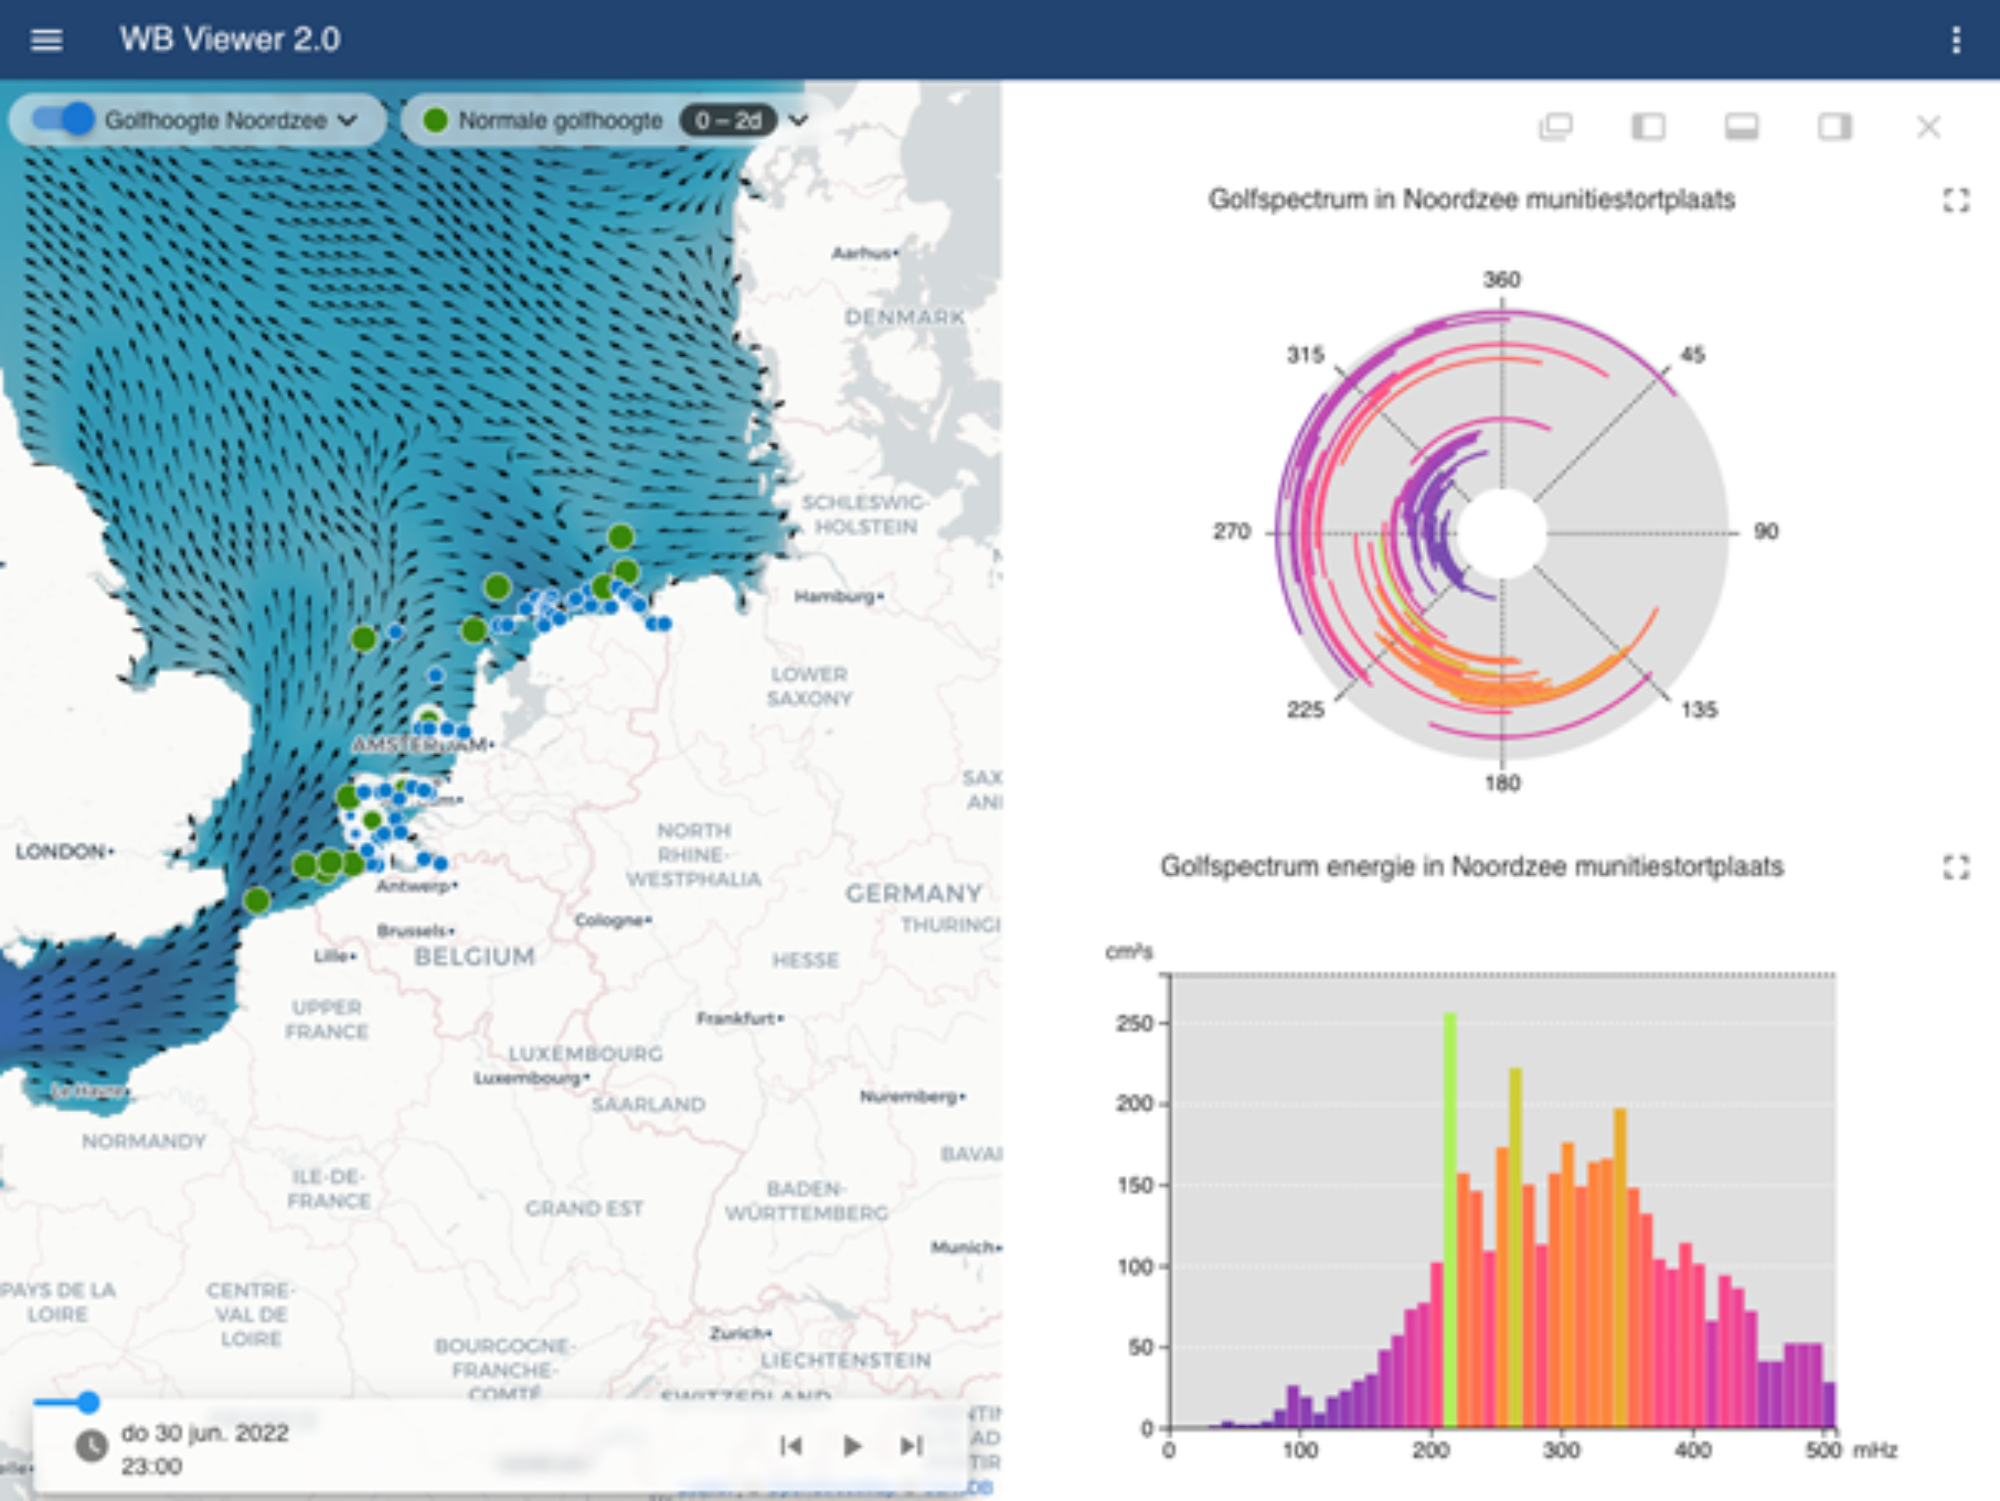
A particularly nice development is the visualization of wave forecasts, which replaces an old Java applet. The first element is a map of the North Sea, with a layer for wave height and observation locations where more information is available. By clicking on such a location, the user can open a panel with the following graphs: a polar graph showing the energy density against the direction and wave frequency; a wave spectrum; and a table with the most important characteristics. The first graph nicely illustrates that waves (high frequencies) and swell (low frequencies) might move in different directions.
Such a graph is difficult or impossible to create with standard graph libraries. Therefore, we have chosen to use the D3.js library. This library offers low-level visualization components from which we can build very specific high-level components. This allows us to make exactly what we need without having to conform to standard visualizations. This, in turn, makes it possible to closely match the wishes of the users.
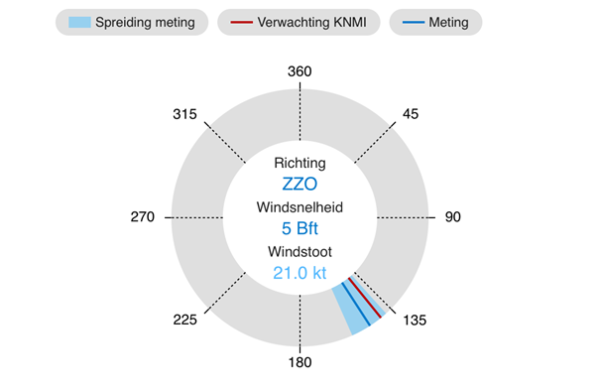
In the visualization of the wind rose, the scale for the wind speed can be easily adjusted from meters per second to Beaufort or knots, again offering the information in a way that closely matches the needs of the users.
From intuition to statistically sound
Another interesting feature of our work on the water information service, is that we sometimes need to formalize what the WMCN advisors do by intuition based on their experience from many years. By creating statistically sound information automatically, we save the advisors a lot of information and at the same time take out the subjectivity in their assessments.
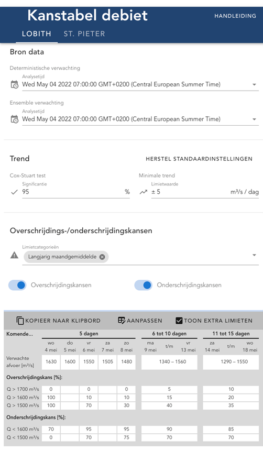
A nice example of this is the tool for building the probability table. This table is an overview of the probability that the flow in the river at Lobith exceeds a certain level. The probability is based on a forecast plume: a large number of forecasts with slightly different settings. This plume shows the variance in the forecasts. The trend is also shown in the table: whether the flow rate is increasing or decreasing. Before, the WMCN advisors determined the trend by just looking at the data. Now, a statistical test, the Cox-Stuart test, is used. By setting a minimum value, the user can specify when the trend is considered to be significant.
The user can also modify the table, for example by including the non exceedance probability, and by choosing a different limit category.
Verification
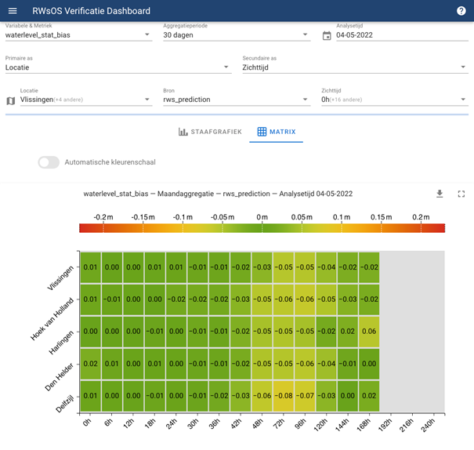
The last example is the verification tooling dashboard that is in development. This is intended to show whether model forecasts have been computed correctly. It shows the match between the forecasts and the observations that are available up to now. This exposes any errors in the model (or observations).
Statistics of the difference between observations and models are computed: the bias, or structural difference between two timeseries, and the standard deviation. These numbers will indicate for example when it is time to recalibrate the models.
This tooling highlights the broad range of information that the advisors need to have at their disposal. For example, the statistics are available over multiple time periods (1 day, 7 days, 30 days) and for various times ahead (1 hour, 2 hours, 24 hours, 48 hours). We are working on functionality to let the user freely change the conditions for the statistics, like changing the aggregation periods.
Finally
Developing this kind of functionality not only requires a close alignment between developers, WMCN advisors and management, but also the contribution from a knowledge institute like Deltares. The steering group brings together all these stakeholders. The challenge is then to find a design that is optimal for all, rather than a compromise which is suboptimal for everyone.
Building the specialized information system for WMCN is just the kind of work we like to do at VORtech. It is not only challenging in terms of software development, creating solutions that cannot be made with standard tools. It is also about listening to the advisors and other stakeholders. Only by combining the knowledge and experience of the users with our knowledge of statistics, physics, the application domain, and software development, can we arrive at an optimal result.
In the end, this is an extremely important application: with every storm we realize how important it is to do our work properly, even if we are only a small part of the Dutch water management sector.
If you are interested to get our support in developing a specialized information system, feel free to contact us to explore the options.