
A dashboard for water information
Good information about water levels and flows in coastal areas is important for many stakeholders. VORtech created a new version of the Water Information Viewer (WB-viewer) for this. It gives the Hydro Meteo Centre of the Dutch Rijkswaterstaat an even better dashboard with information on the coastal waters.
A dashboard for everyone
The WB-viewer is important for a wide variety of people like skippers, pilots and the managers of locks and harbours. As each of these users has different needs, they have to be able to select their own information. That is exactly one of the strong points of the WB-viewer. Another is the visually attractive presentation of the information.
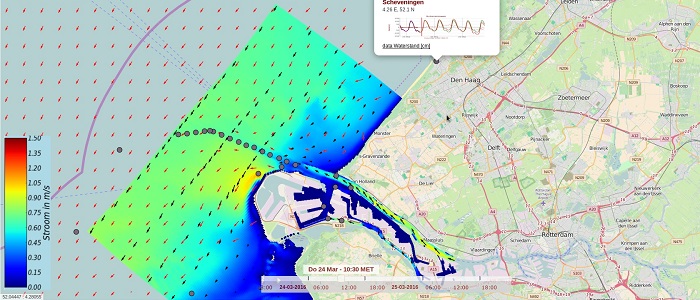
Through waterberichtgeving.rws.nl users can select dashboards for different areas and applications. There is a viewer for the Westerschelde area, for example, which immediately shows the flow situation there. By clicking on the time widget at the bottom of the viewer you can see how the flow will evolve in the next few hours. At certain points on the map (like Vlissingen) you can get graphs of the water levels and flows in the coming period. All this helps the user to quickly assess the situation as far as it is relevant for her, zooming in when necessary and reading specific values from the map.
The ability to quickly configure a dashboard for a particular situation was a key element in the design of the WB-viewer. This made it possible, for example, to create a specific dashboard for The Ocean Cleanup. This innovative company strives to clean the oceans with new technology. Another nice application is the visualisation of HF-radar data. These are the observations of the flow field that are done with high-frequency radar from the Dutch coast. An important advantage of HF-radar is that it provides information about a large part of the shipping lane towards Rotterdam.
New technology
Kwok Li from VORtech is responsible for the improvements of the WB-viewer. “The basis of the viewer was created by Regien Brouwer. She is a self-employed software developer that regularly collaborates with us. A few years ago, she experimented with some new technologies that she thought would make the water information better accessible. She was very much right.” Kwok says. “The dashboard is now based on Leaflet, which is used for the interactive maps. We also use dygraphs to display graphs like the one for water levels.” Both are open source JavaScript packages that make building this kind of application relatively simple.
Rijkswaterstaat is now integrating the WB-viewer in the new design of the water information site. She also actively promotes the new functionality. So far, all reactions are extremely positive. Thus, the WB-viewer will probably play a prominent role in the water information distribution in the coming years.